Analyzed my amazon purchases for the past 6 months during the COVID-19 lock down.
Through the analysis I discovered:
- The total amount I've spent on Amazon during the past 6 months.
- Spending trends by product category and date visualized in a bar graph.
| Total | $2320.71 |
| Average | $48.35 |
| Median | $35.86 |
| Max | $157.06 |
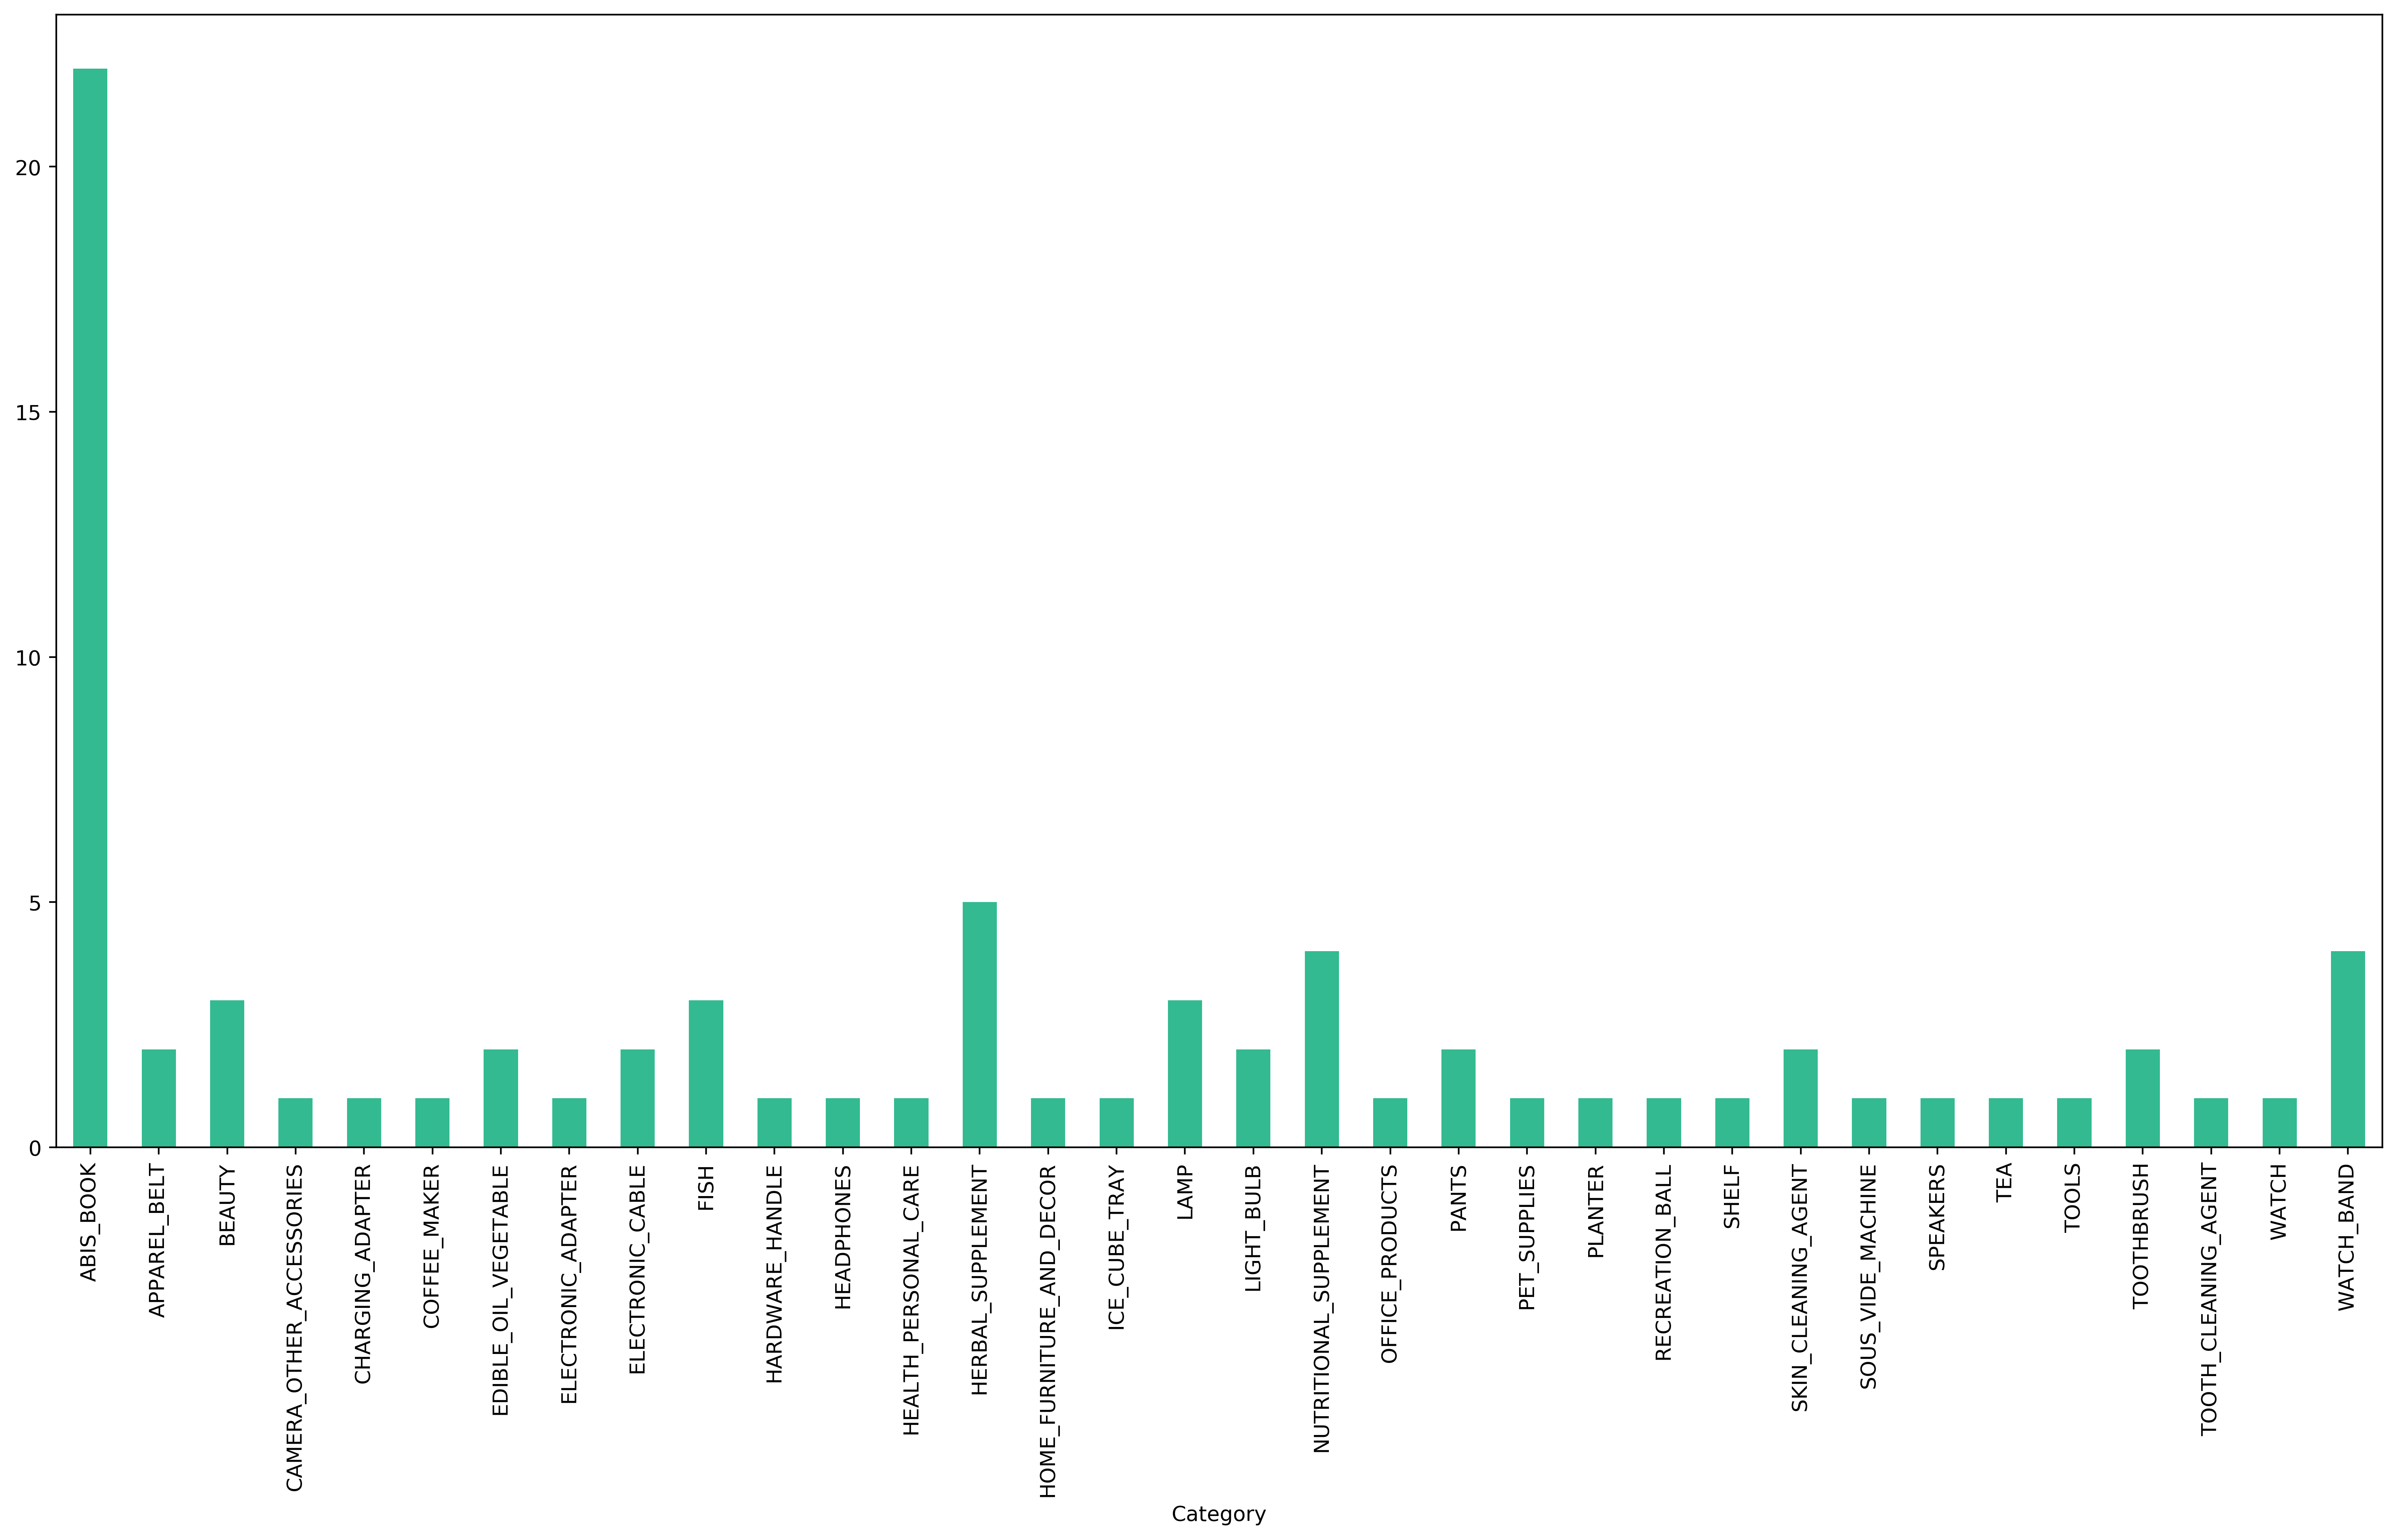
Items by Category:
Most of the items I purchased at during the COVID-19 lock down are books.

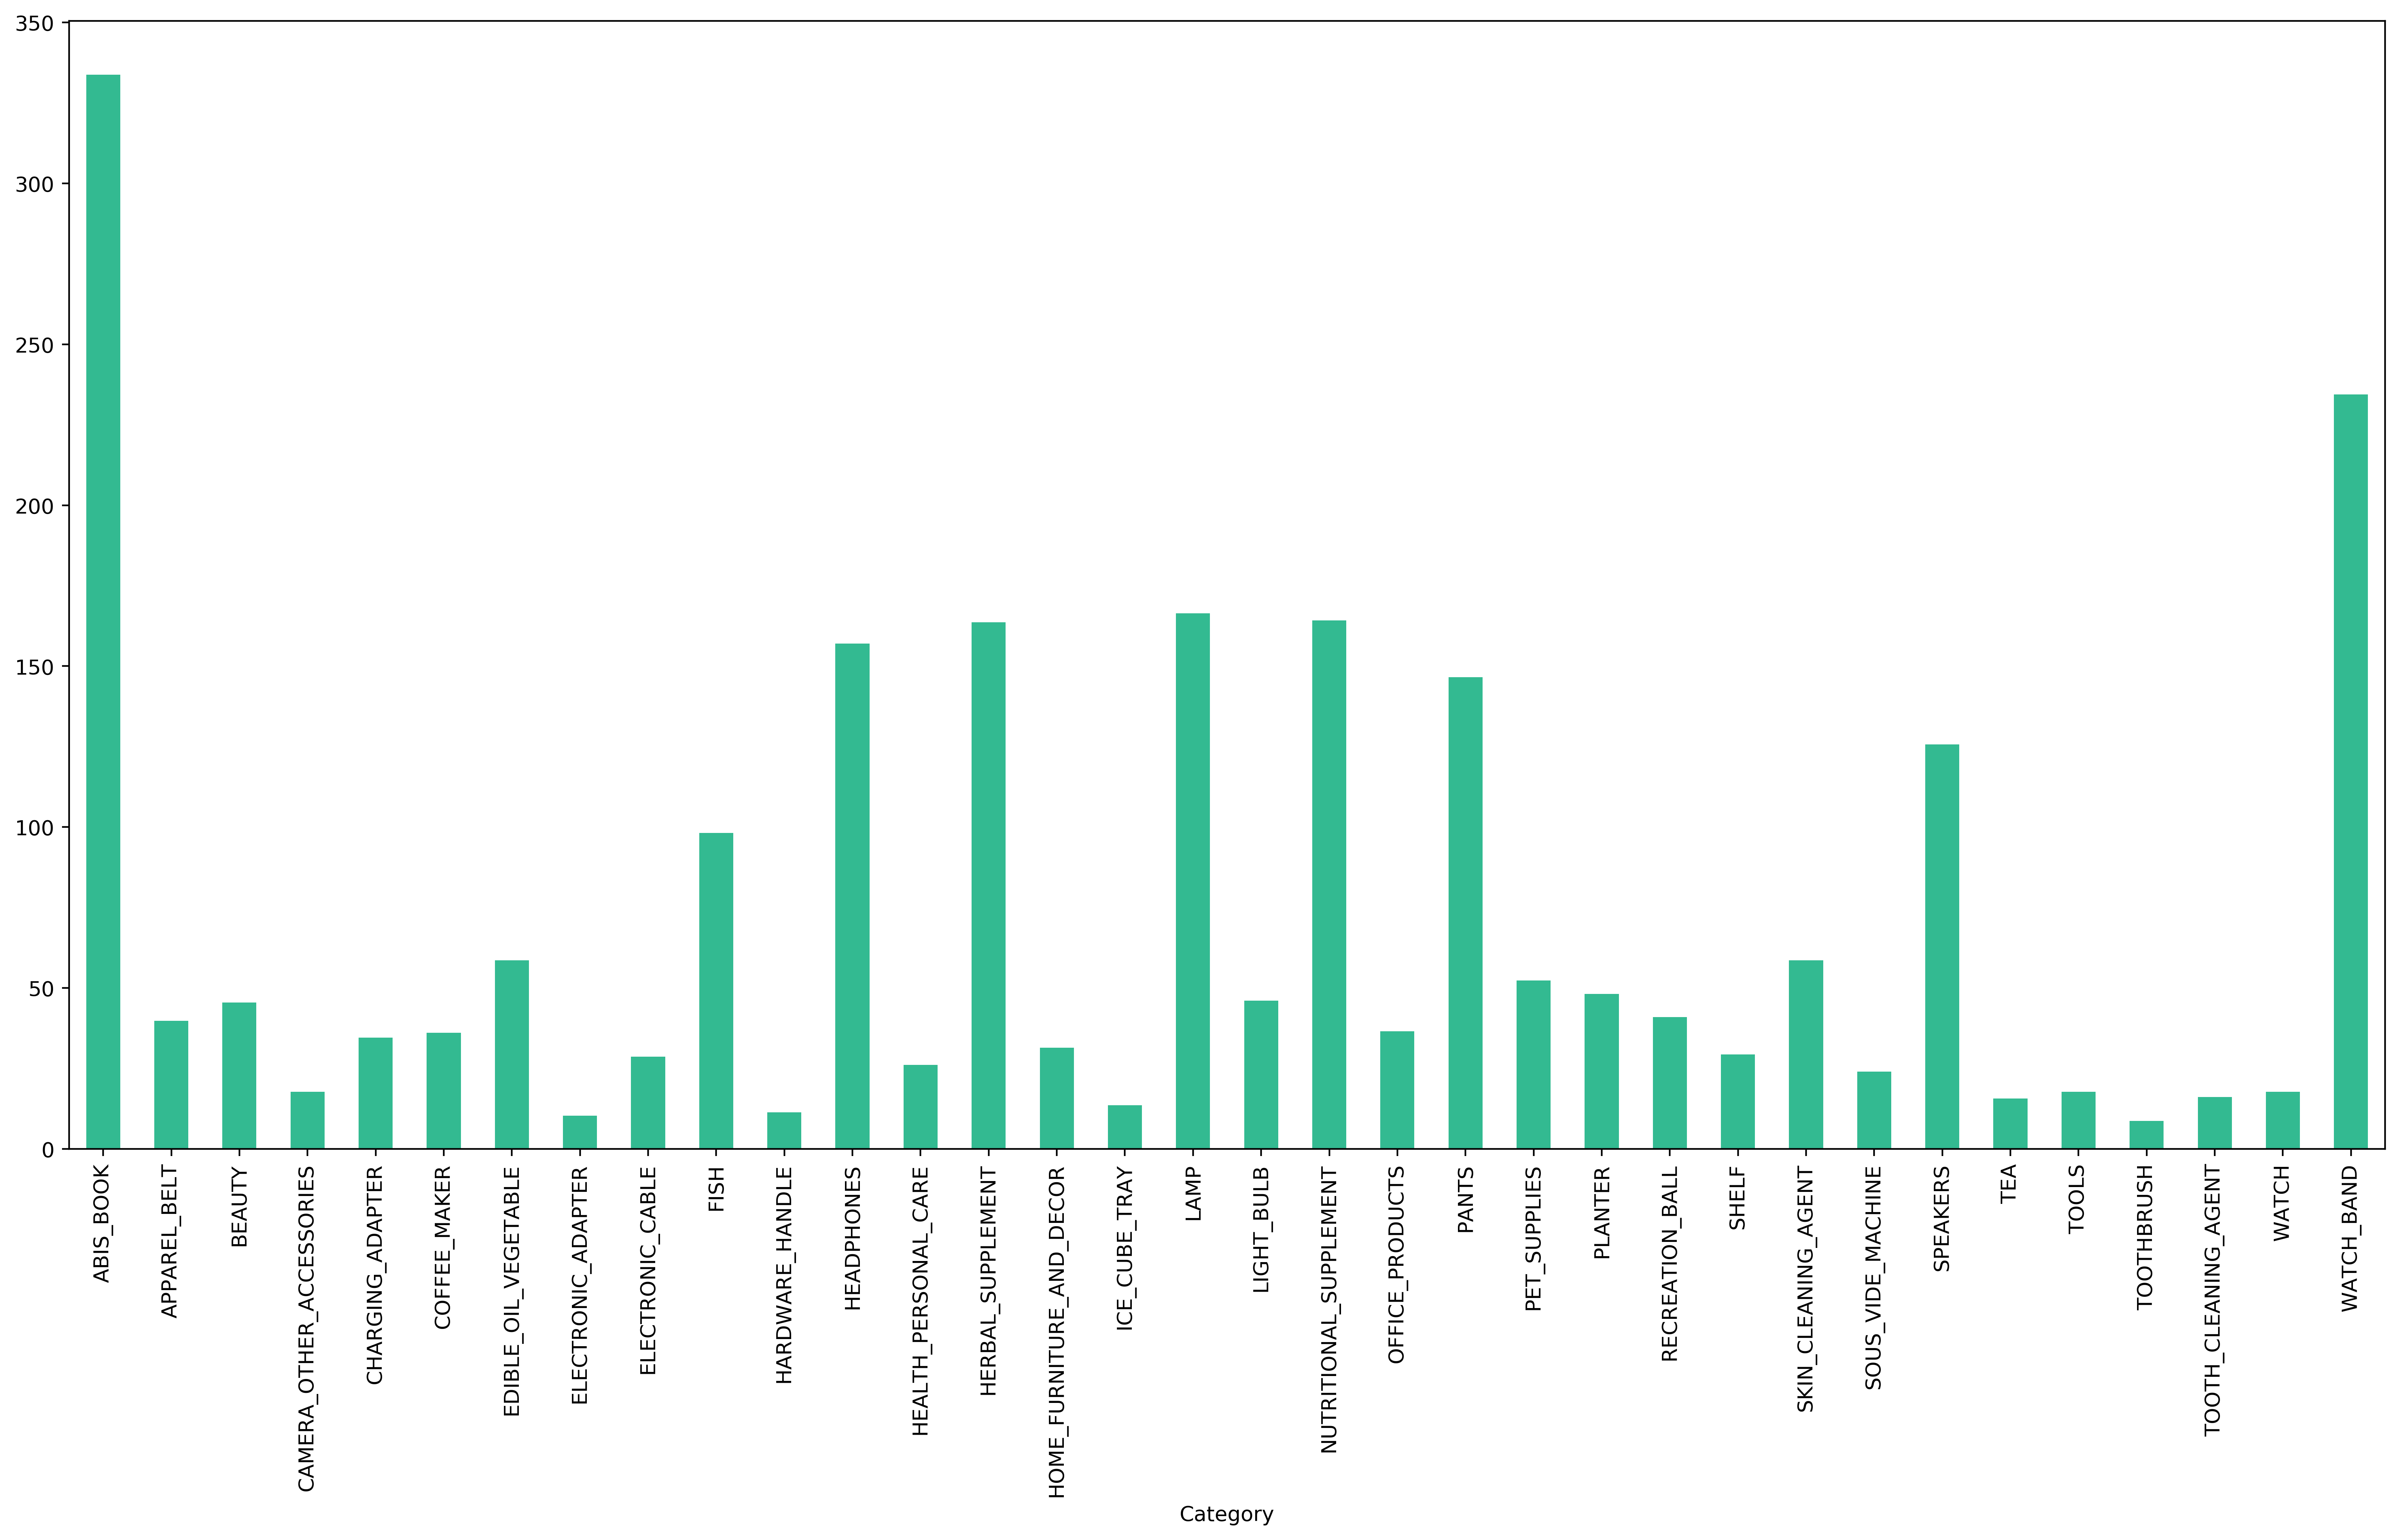
Spending by Category:
My spending this past 6 months came from books, health supplements, electronics, and watch accessories.

Order Total by Date:
The 2 orders that were the highest during this period were an earbud purchase, and I started Subscribe & Save for health supplements.

Jupyter Notebook source code will be provided on GitLab