Analyzed my amazon purchases for the 2nd half of 2021.
Through the analysis I discovered:
- The total amount I've spent on Amazon during the past 6 months.
- Spending trends by product category and date visualized in a bar graph.
| Total | $1837.71 |
| Average | $45.94 |
| Median | $32.89 |
| Max | $183.16 |
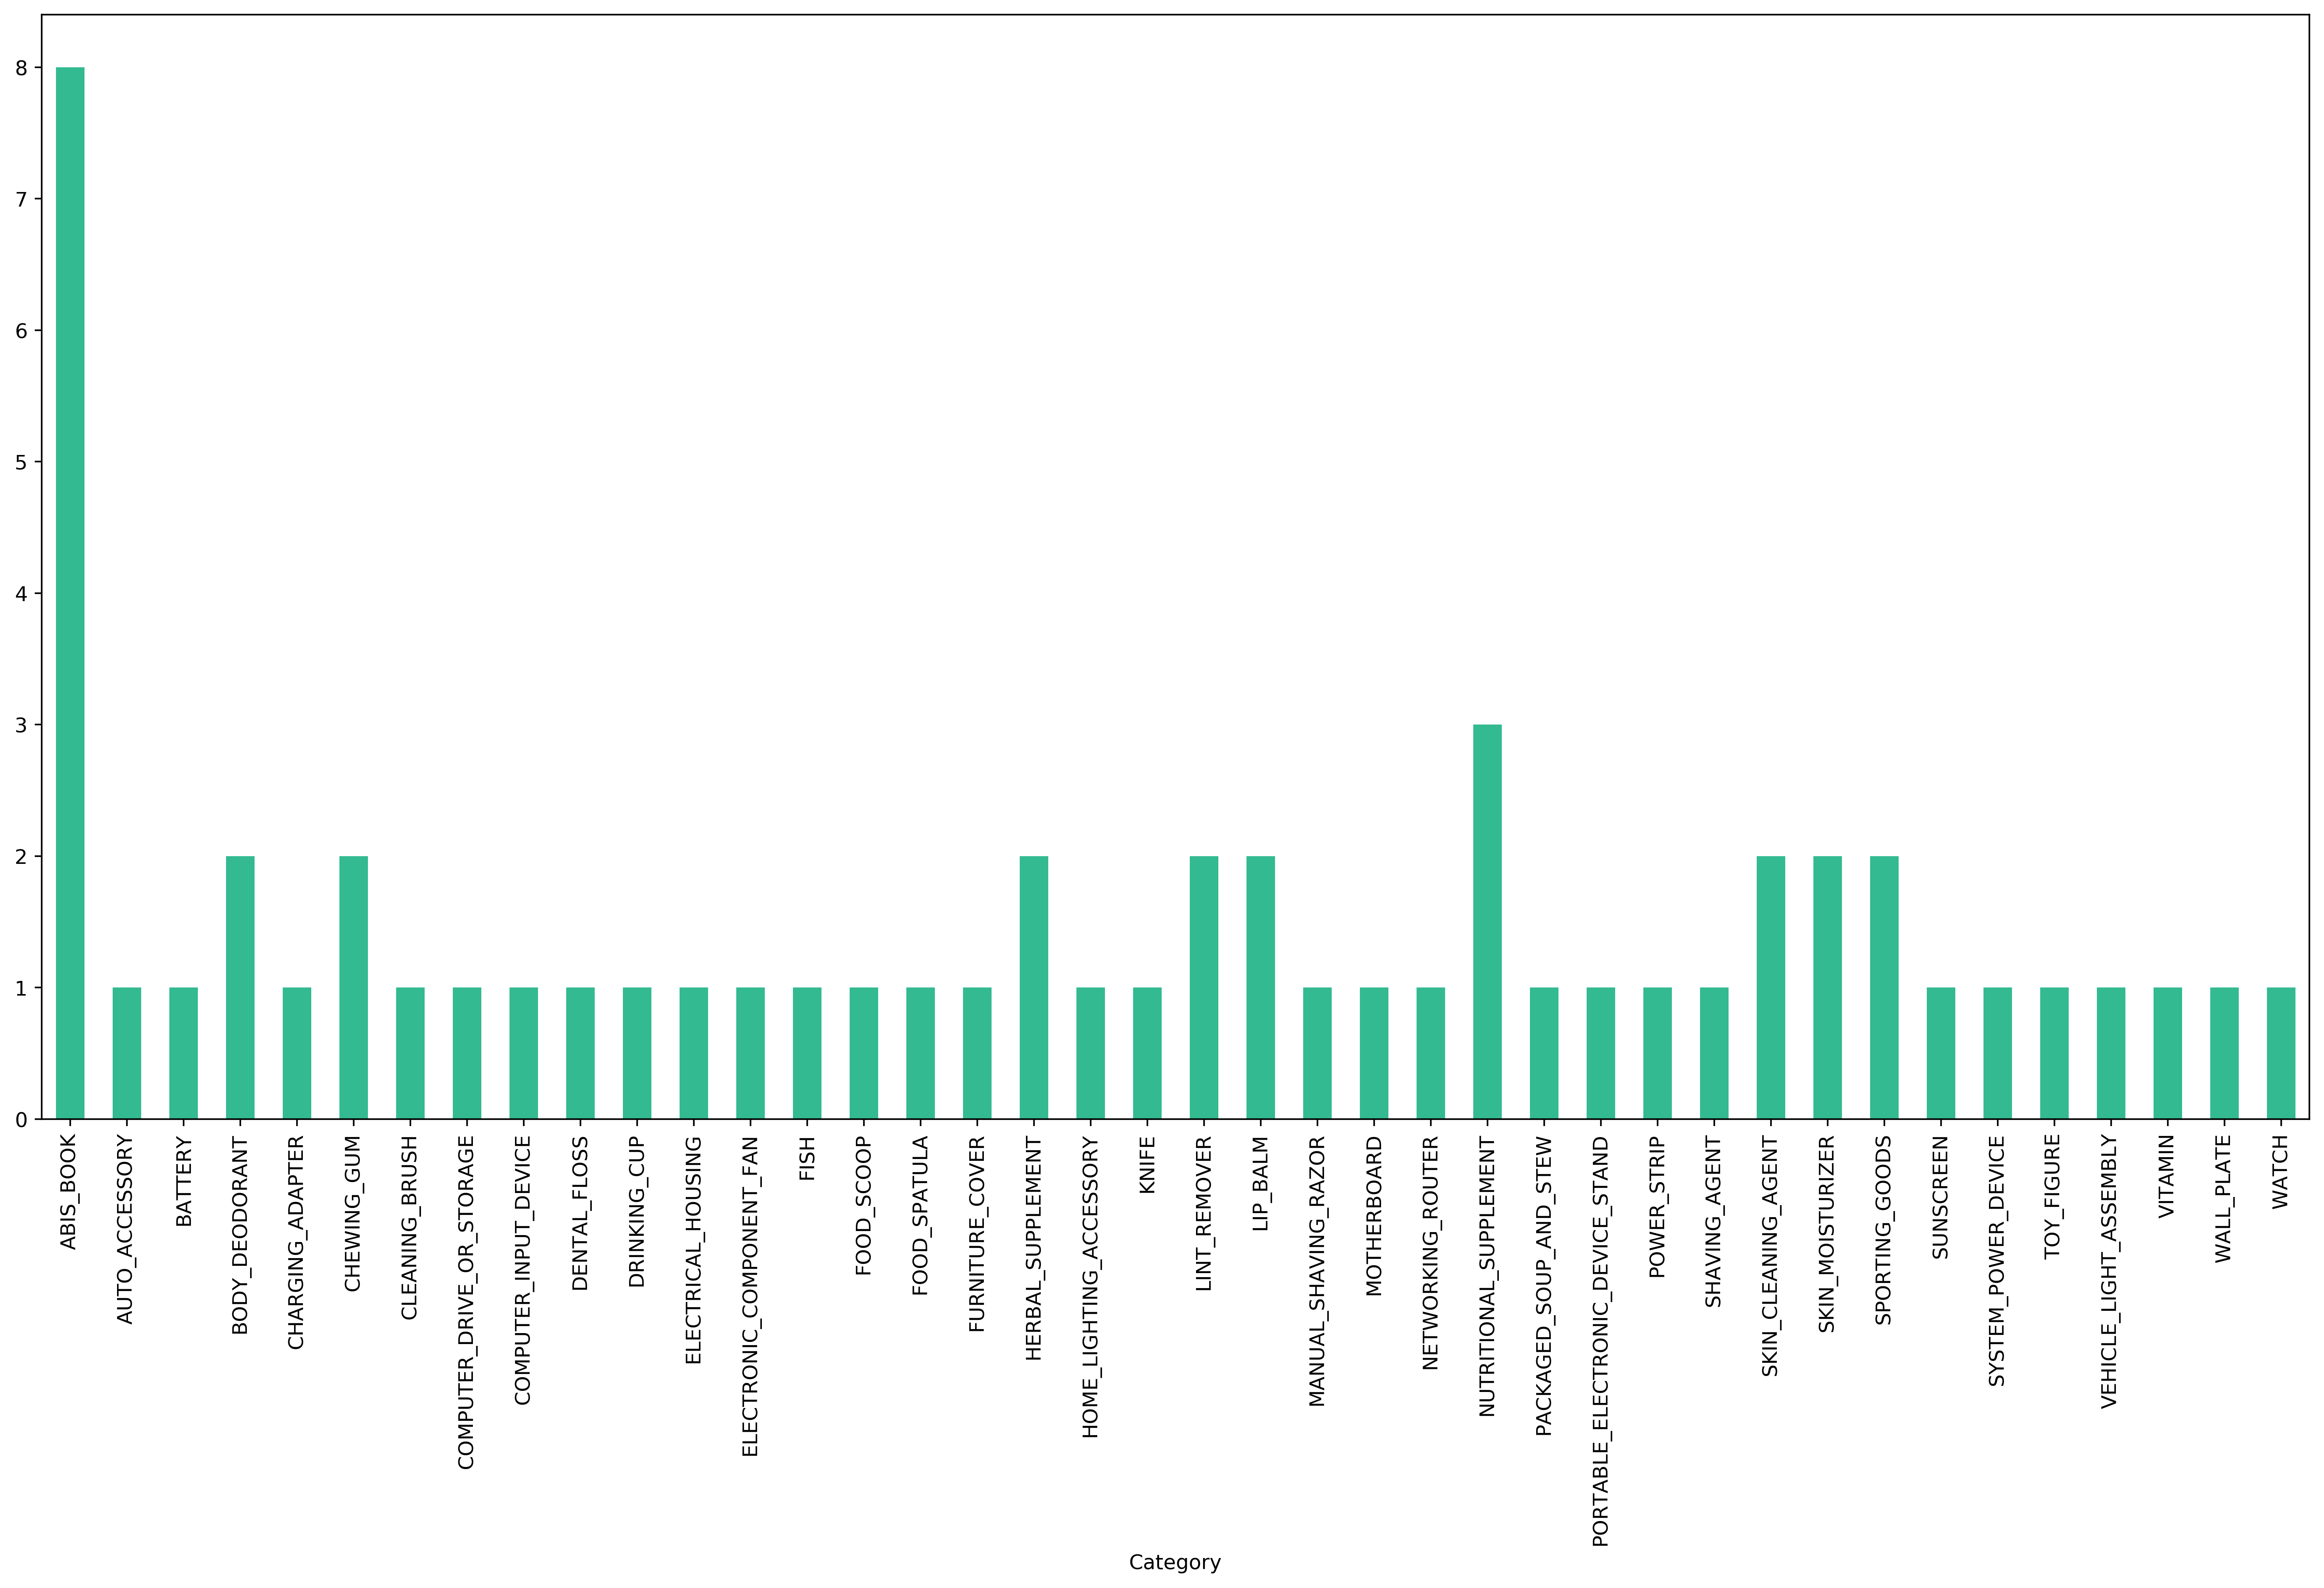
Items by Category:
Bought more books than anything else in the last 6 months.

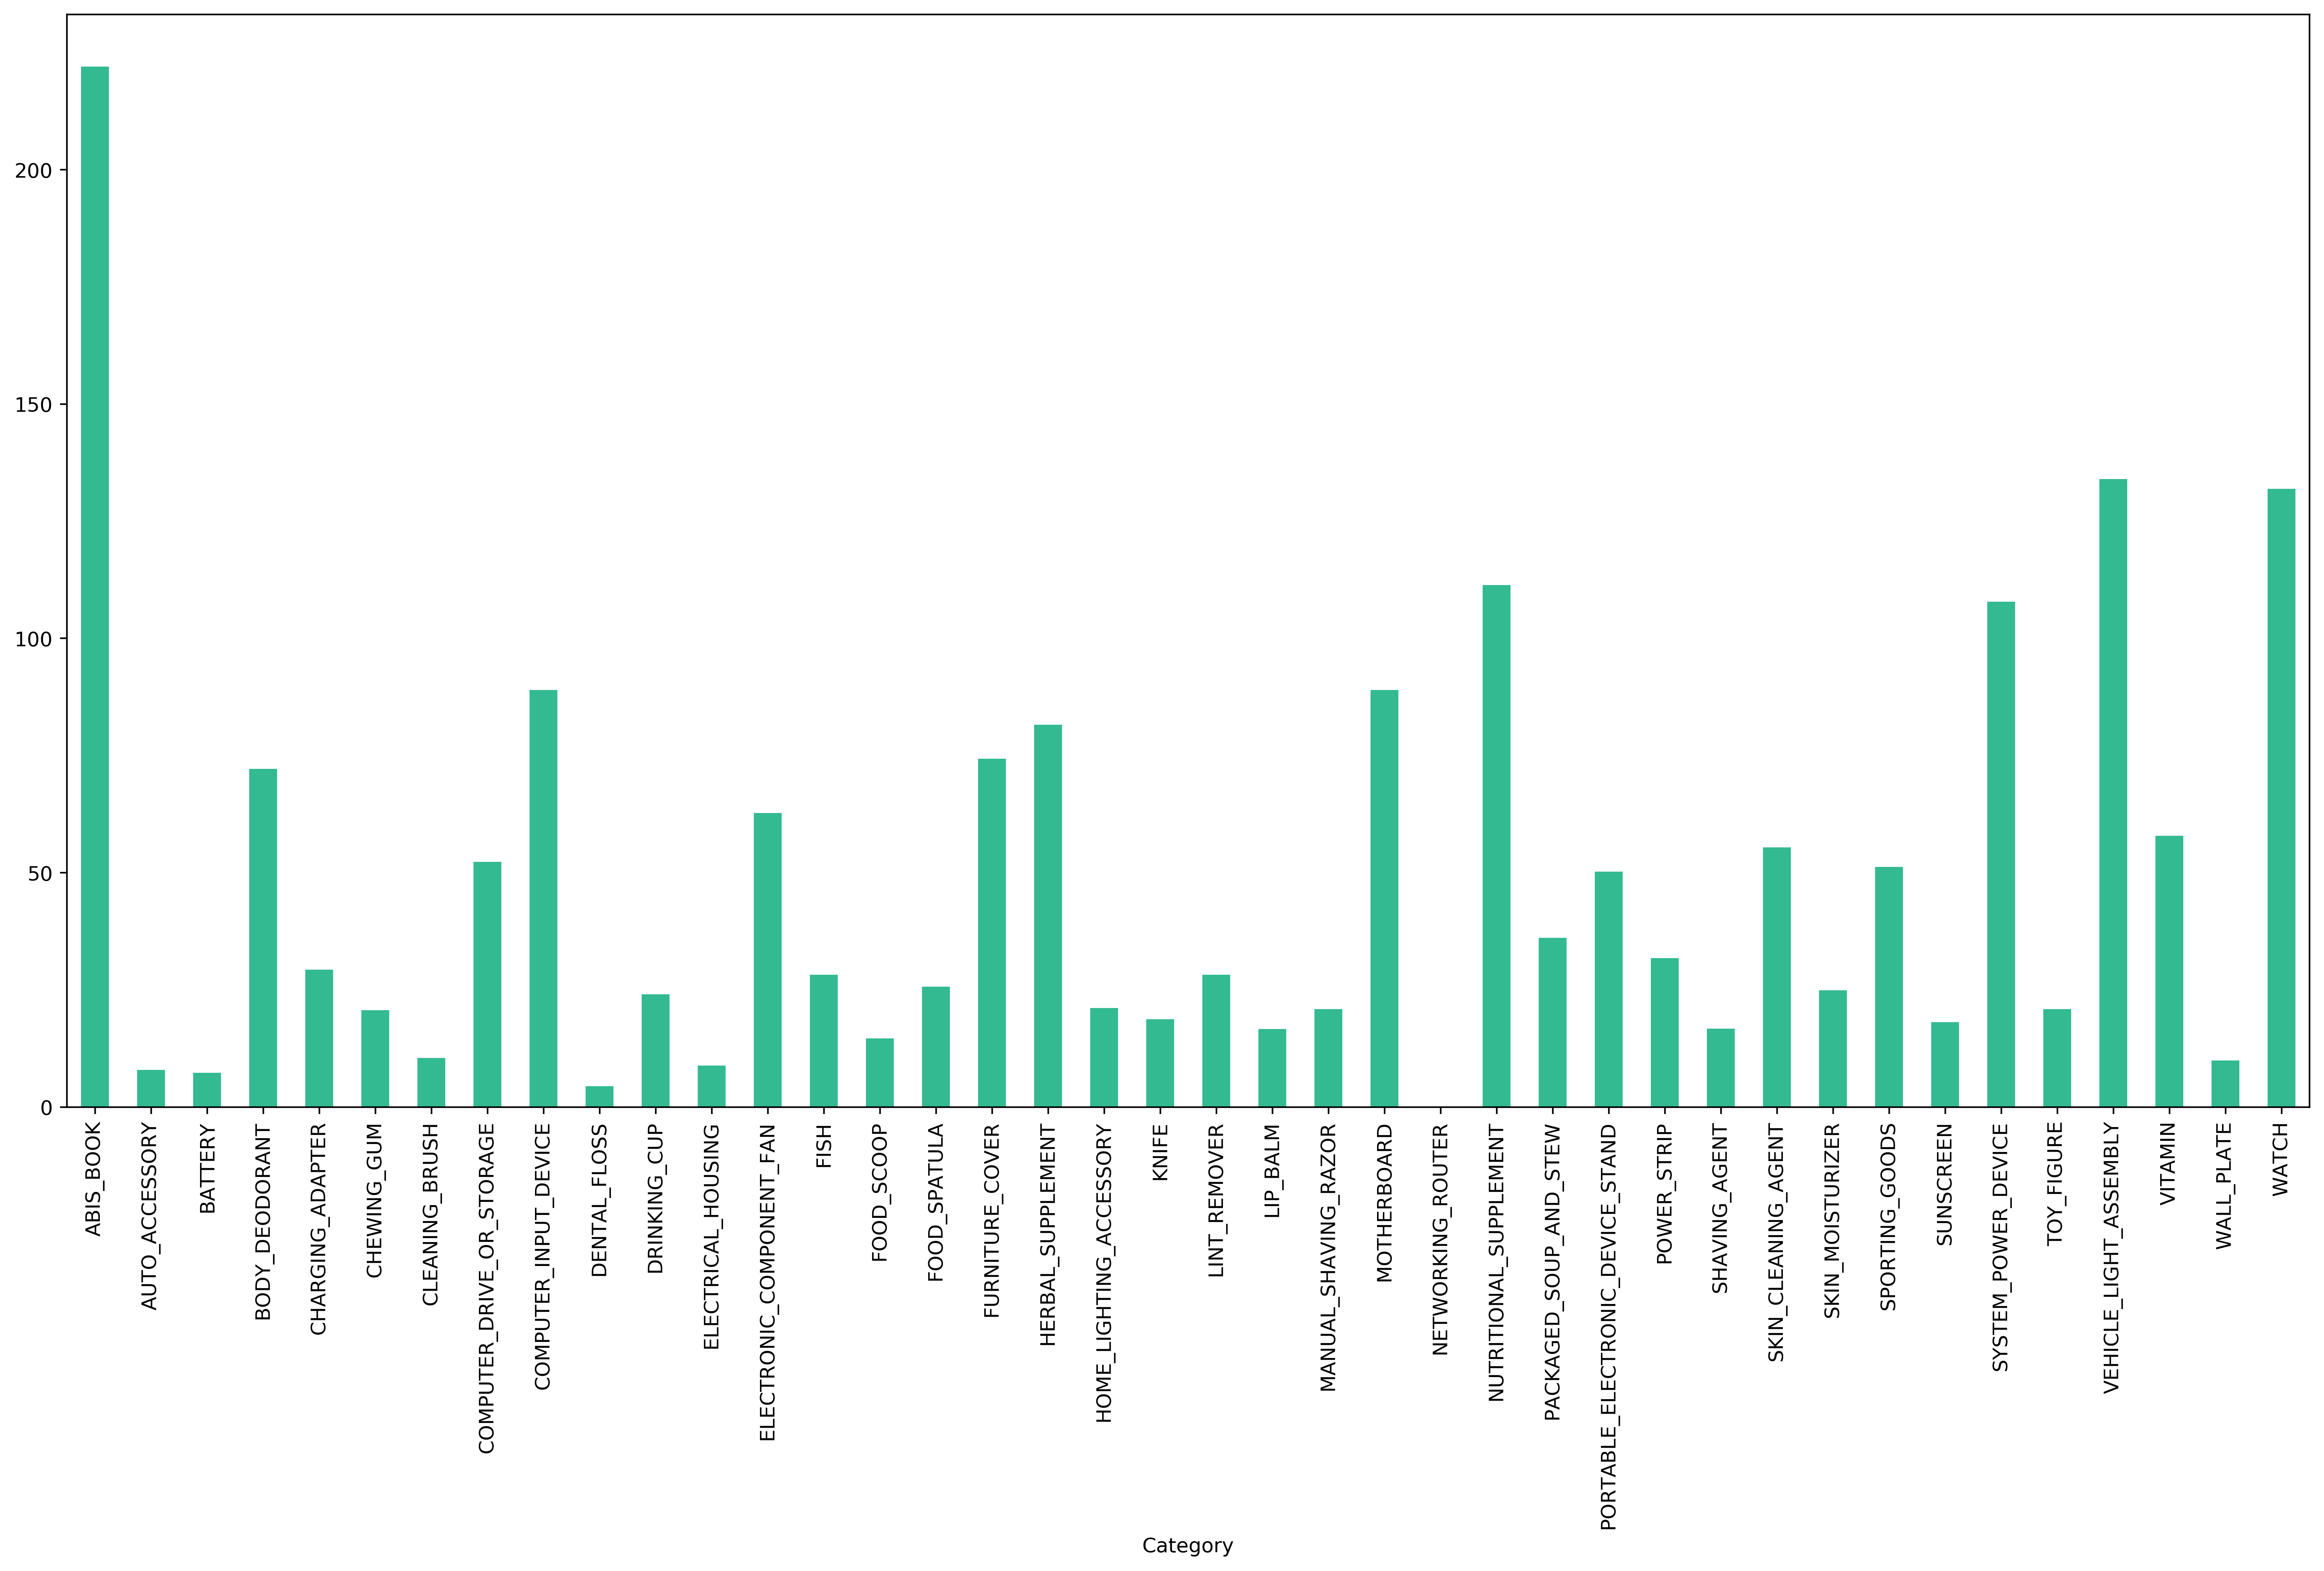
Spending by Category:
Most of my spending came from books, new desktop motherboard and power supply, and a pretty cool watch with Easter Arabic numerals.

Order Total by Date:

Jupyter Notebook source code will be provided on GitLab