Always wondered how much I've spend on Amazon over the years. Downloaded the past 10 years of Amazon data and analyzed the data with some python programming on JupyterLab.
Through the analysis I discovered:
- The total amount I've spent on Amazon.
- My most expensive order, my average and median order totals.
- Various spending trends visualized in a bar graph.
| Total | $12069.01 |
| Average | $58.87 |
| Median | $38.16 |
| Max | $502.58 |
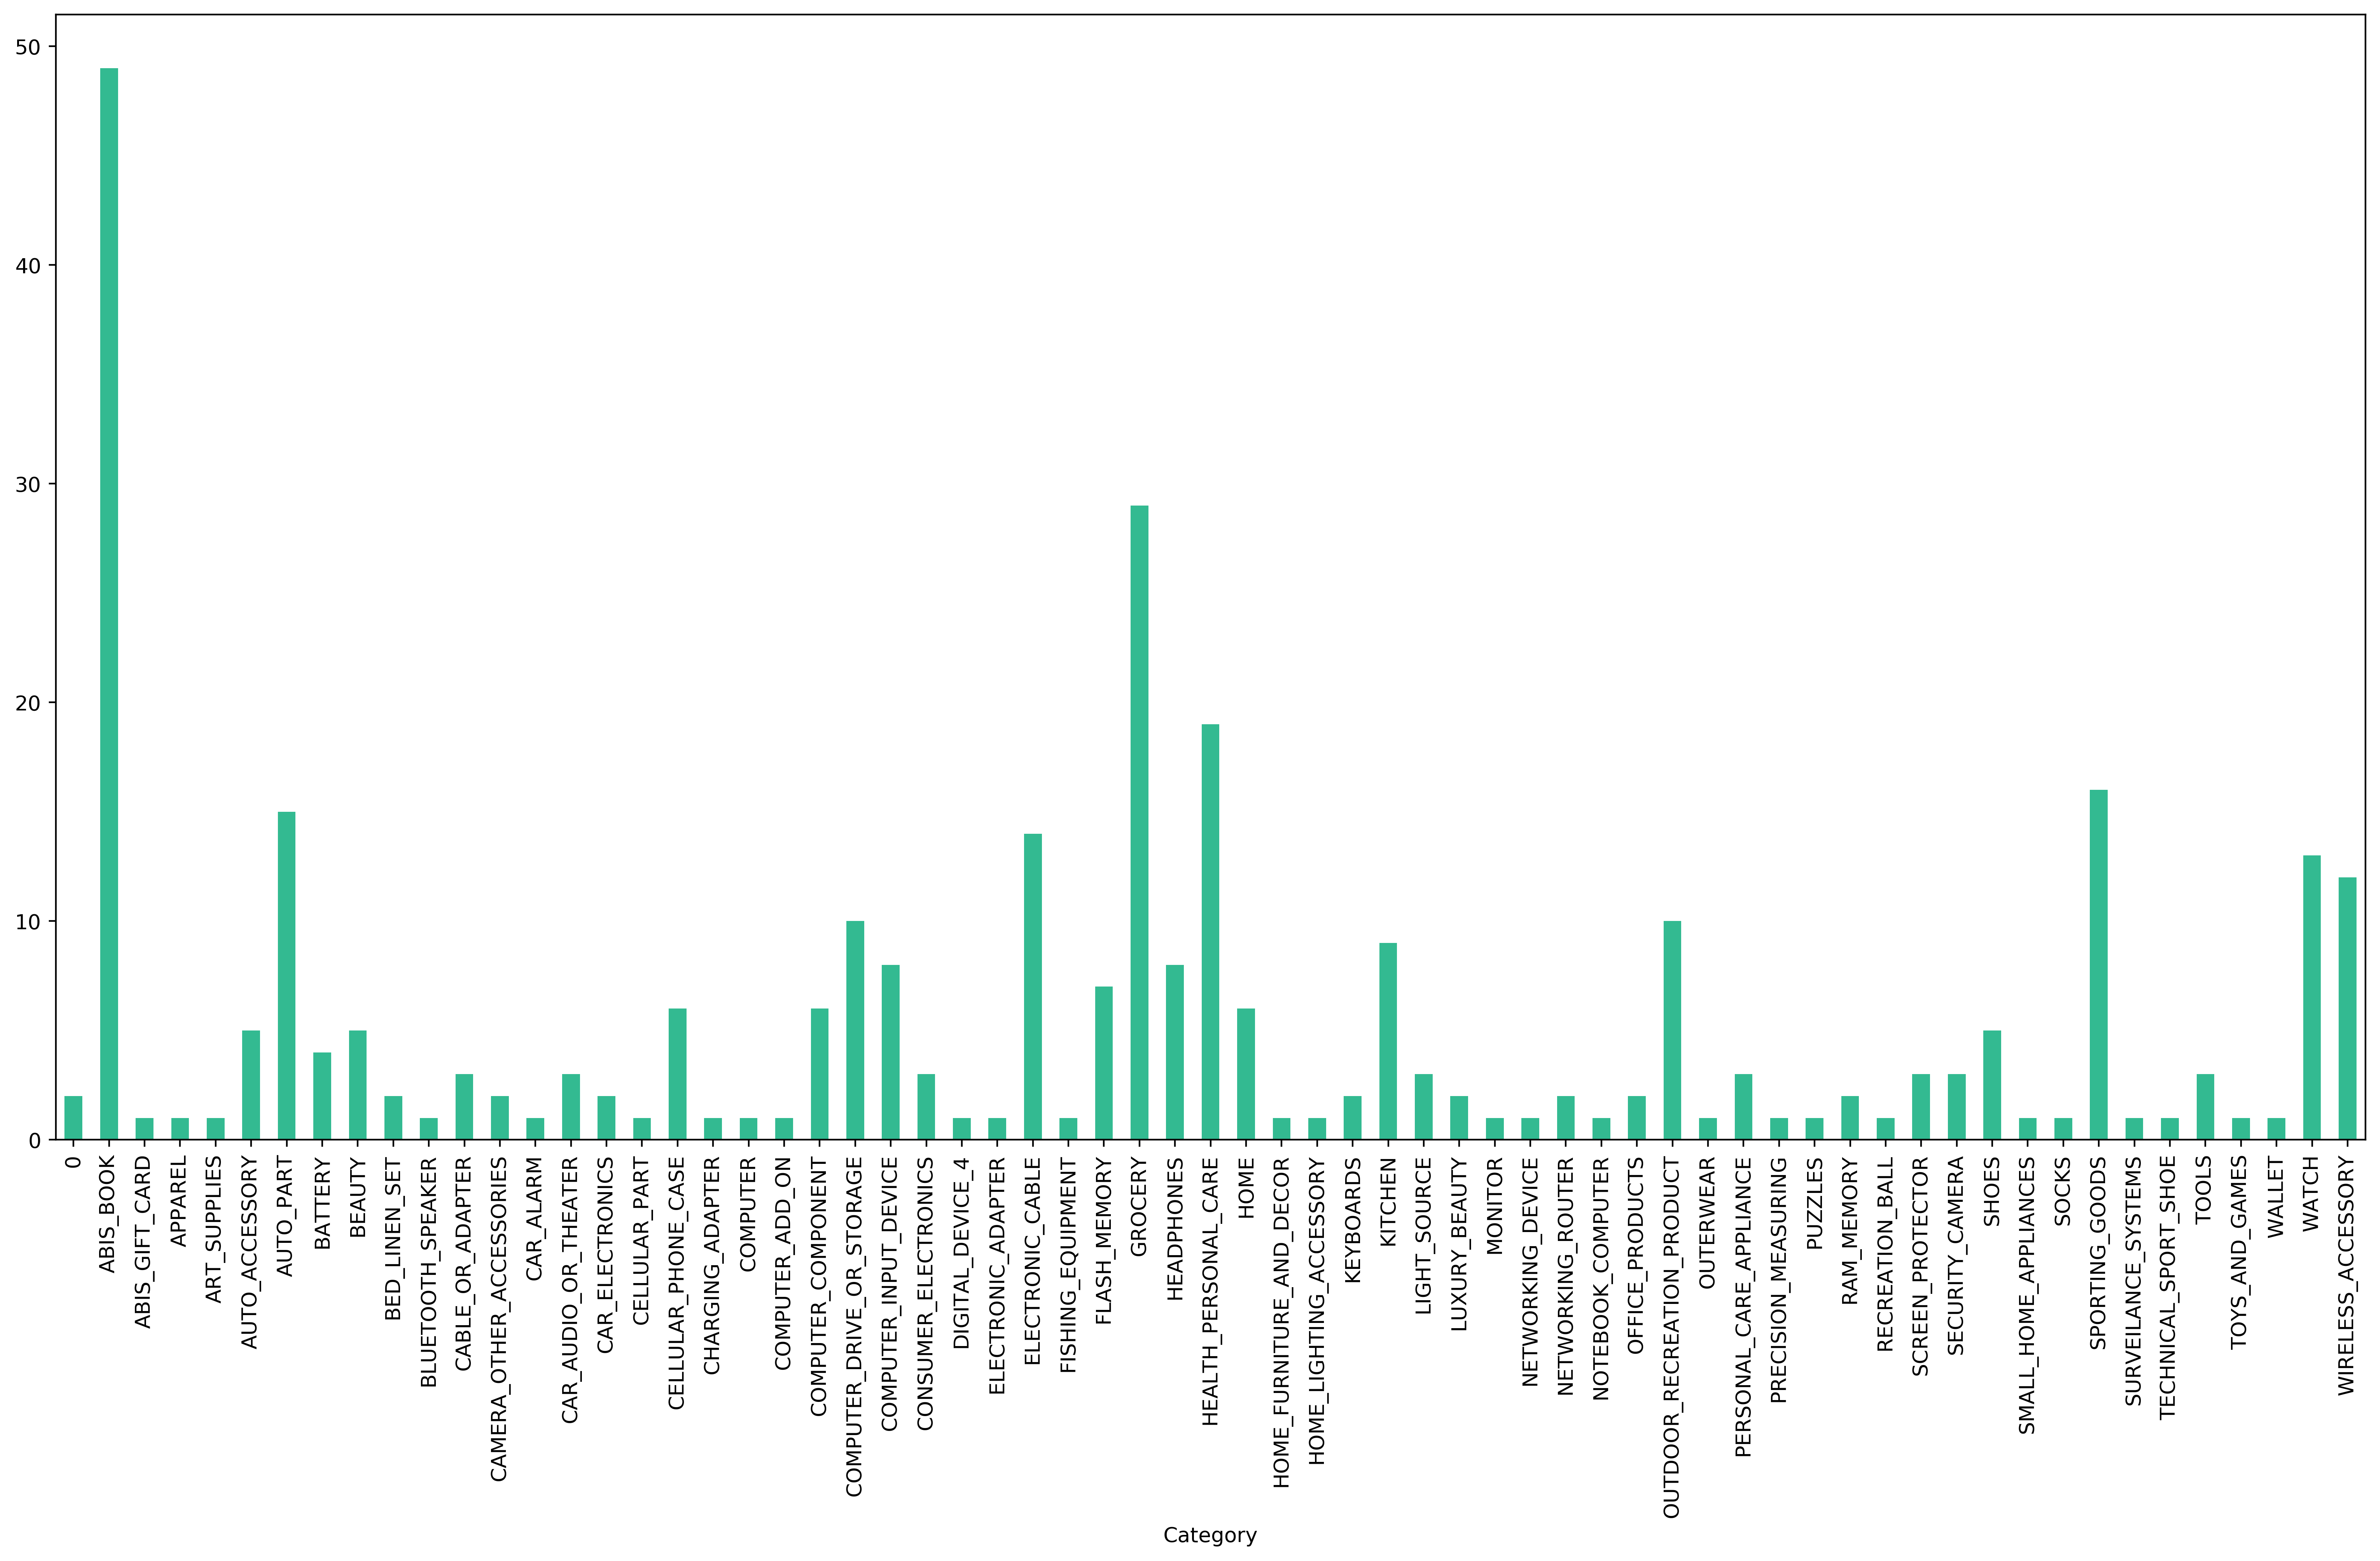
Items by Category:
About half of the items I order from Amazon are books.

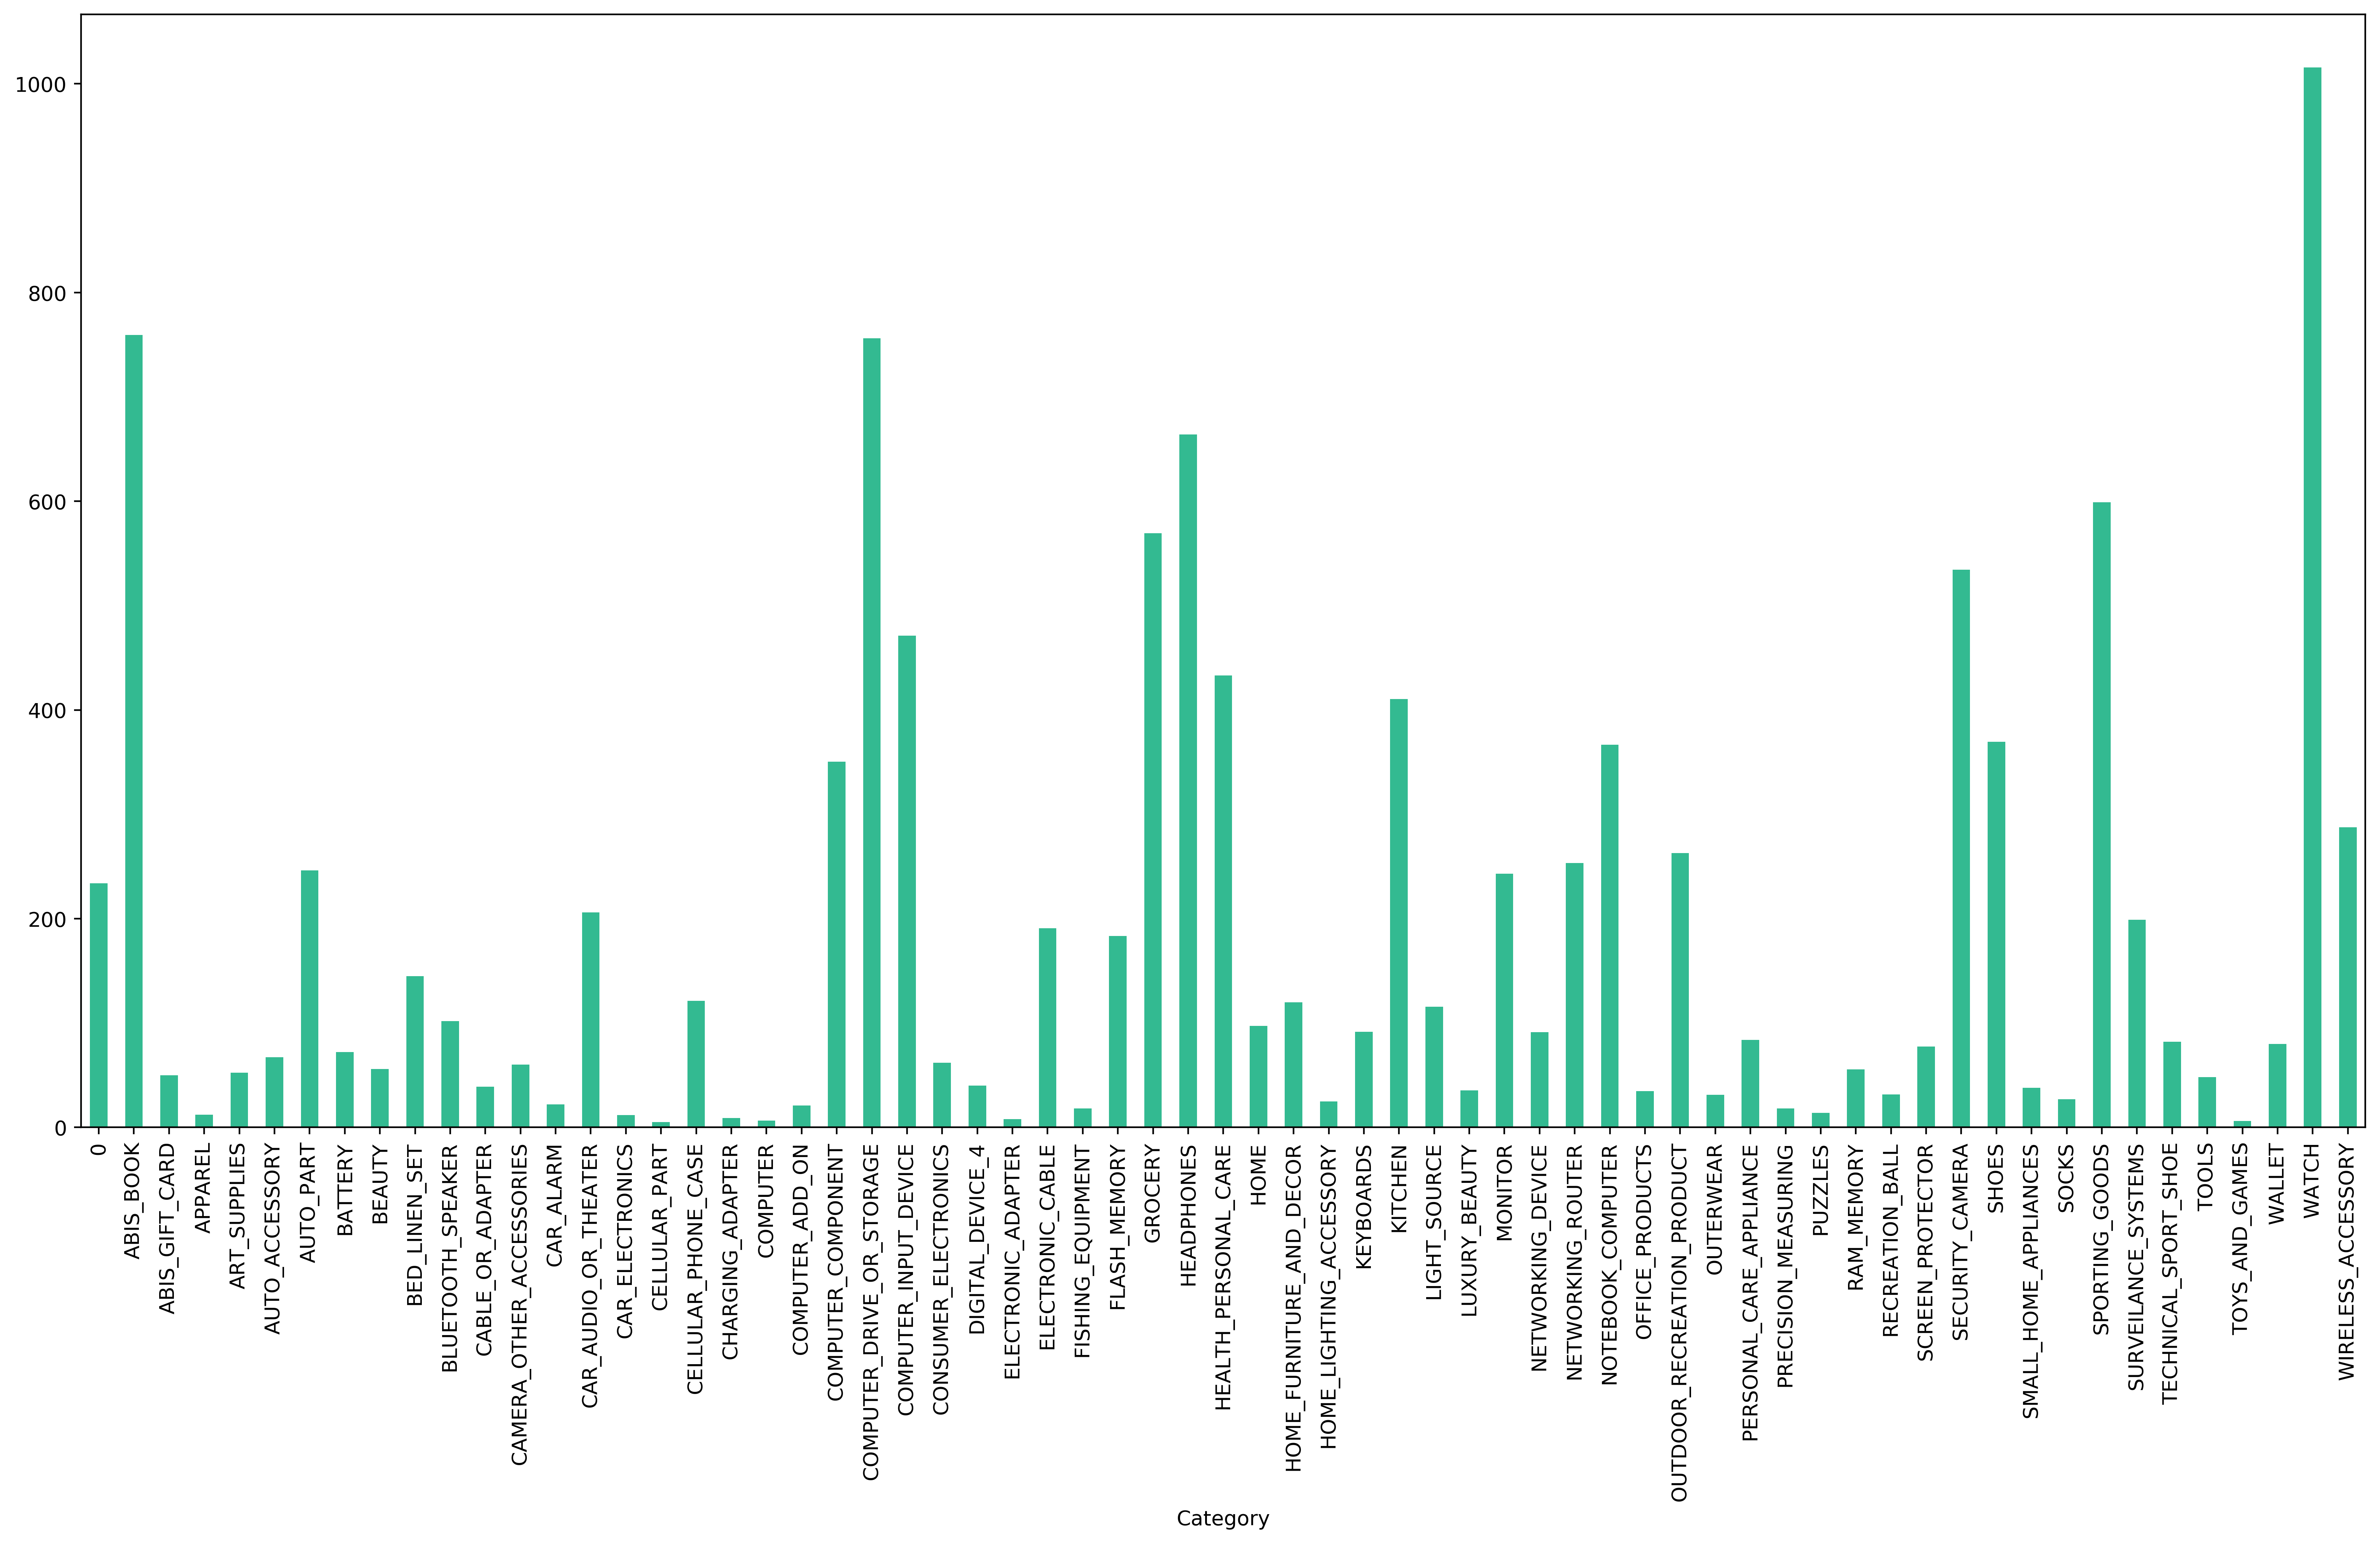
Spending by Category:
Most of my spending come from books, computer parts, electronics, and watches/watch accessories.

Order Total by Date:
Not surprisingly, my spending increases during the holidays.

Jupyter Notebook source code will be provided on GitLab